1. Introduction
WSI is commonly used in digital pathology for disease diagnosis and analysis. Pathologists use WSI to analyze and make critical decisions based on the segmentation of tissue regions of interest (ROIs). Accurate segmentation is essential for the precise diagnosis of diseases such as cancer, as it can affect treatment plans and patient outcomes. However, due to the complexity and variability of tissue samples, automatic segmentation of WSI can be challenging. Conventional image segmentation algorithms [1, 2] mainly rely on edges, which may not work well on WSIs where regions are separated based on texture similarity. Leveraging deep learning segmentation methods [3] is also limited due to the large size of WSI and the limited computational resources.
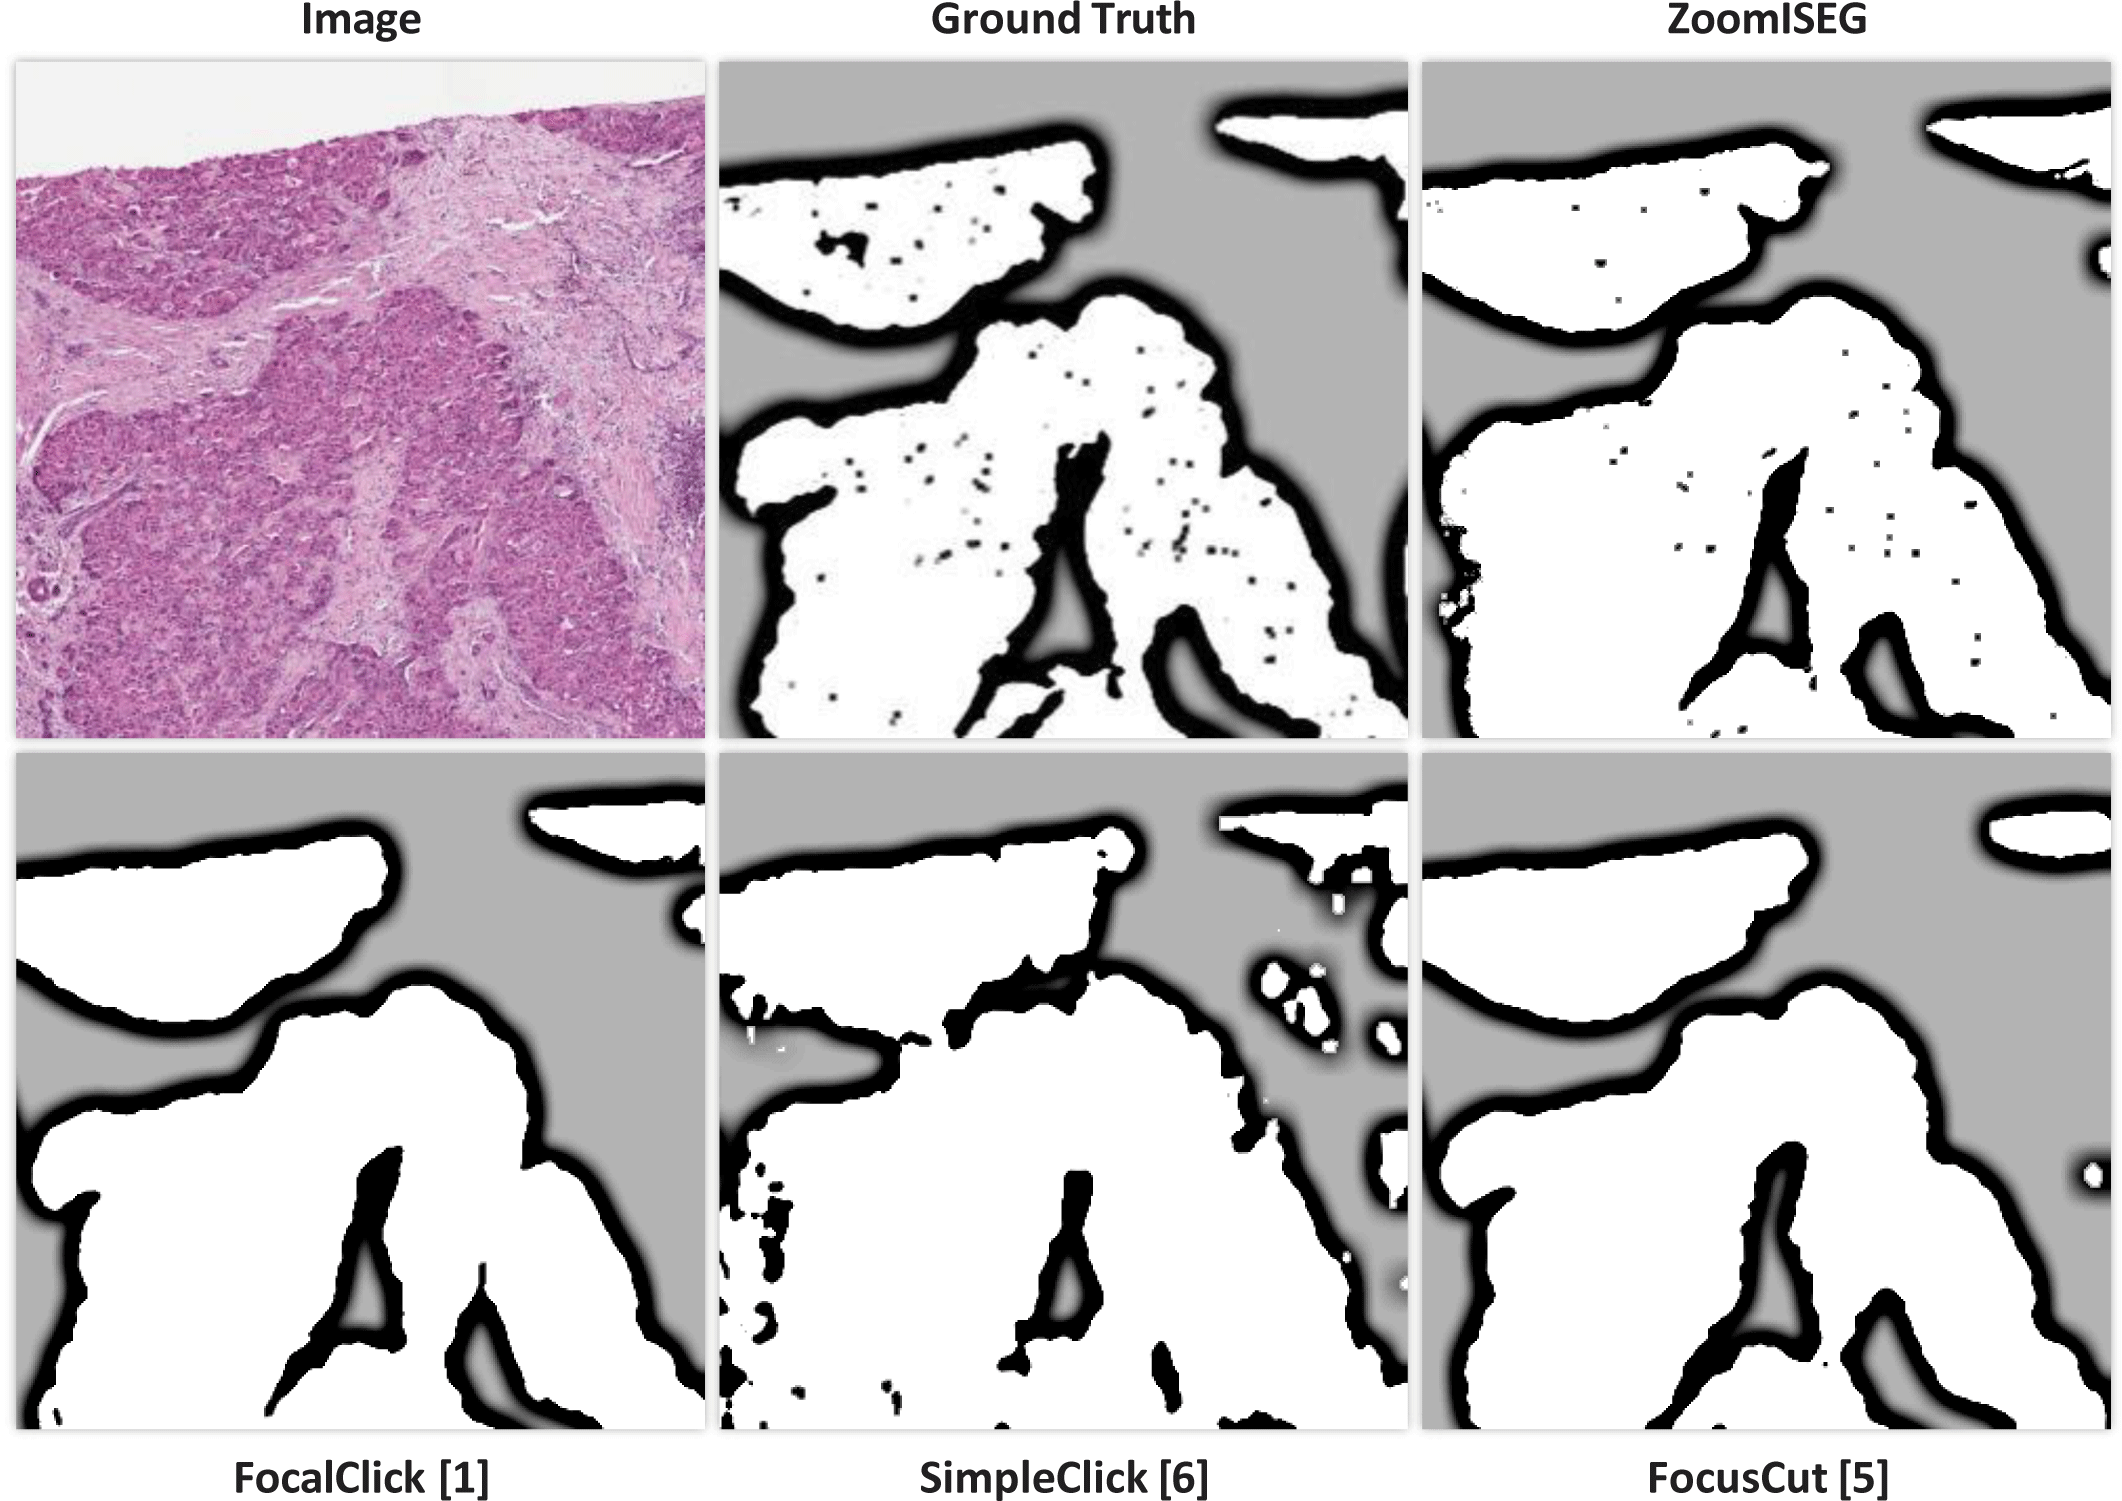
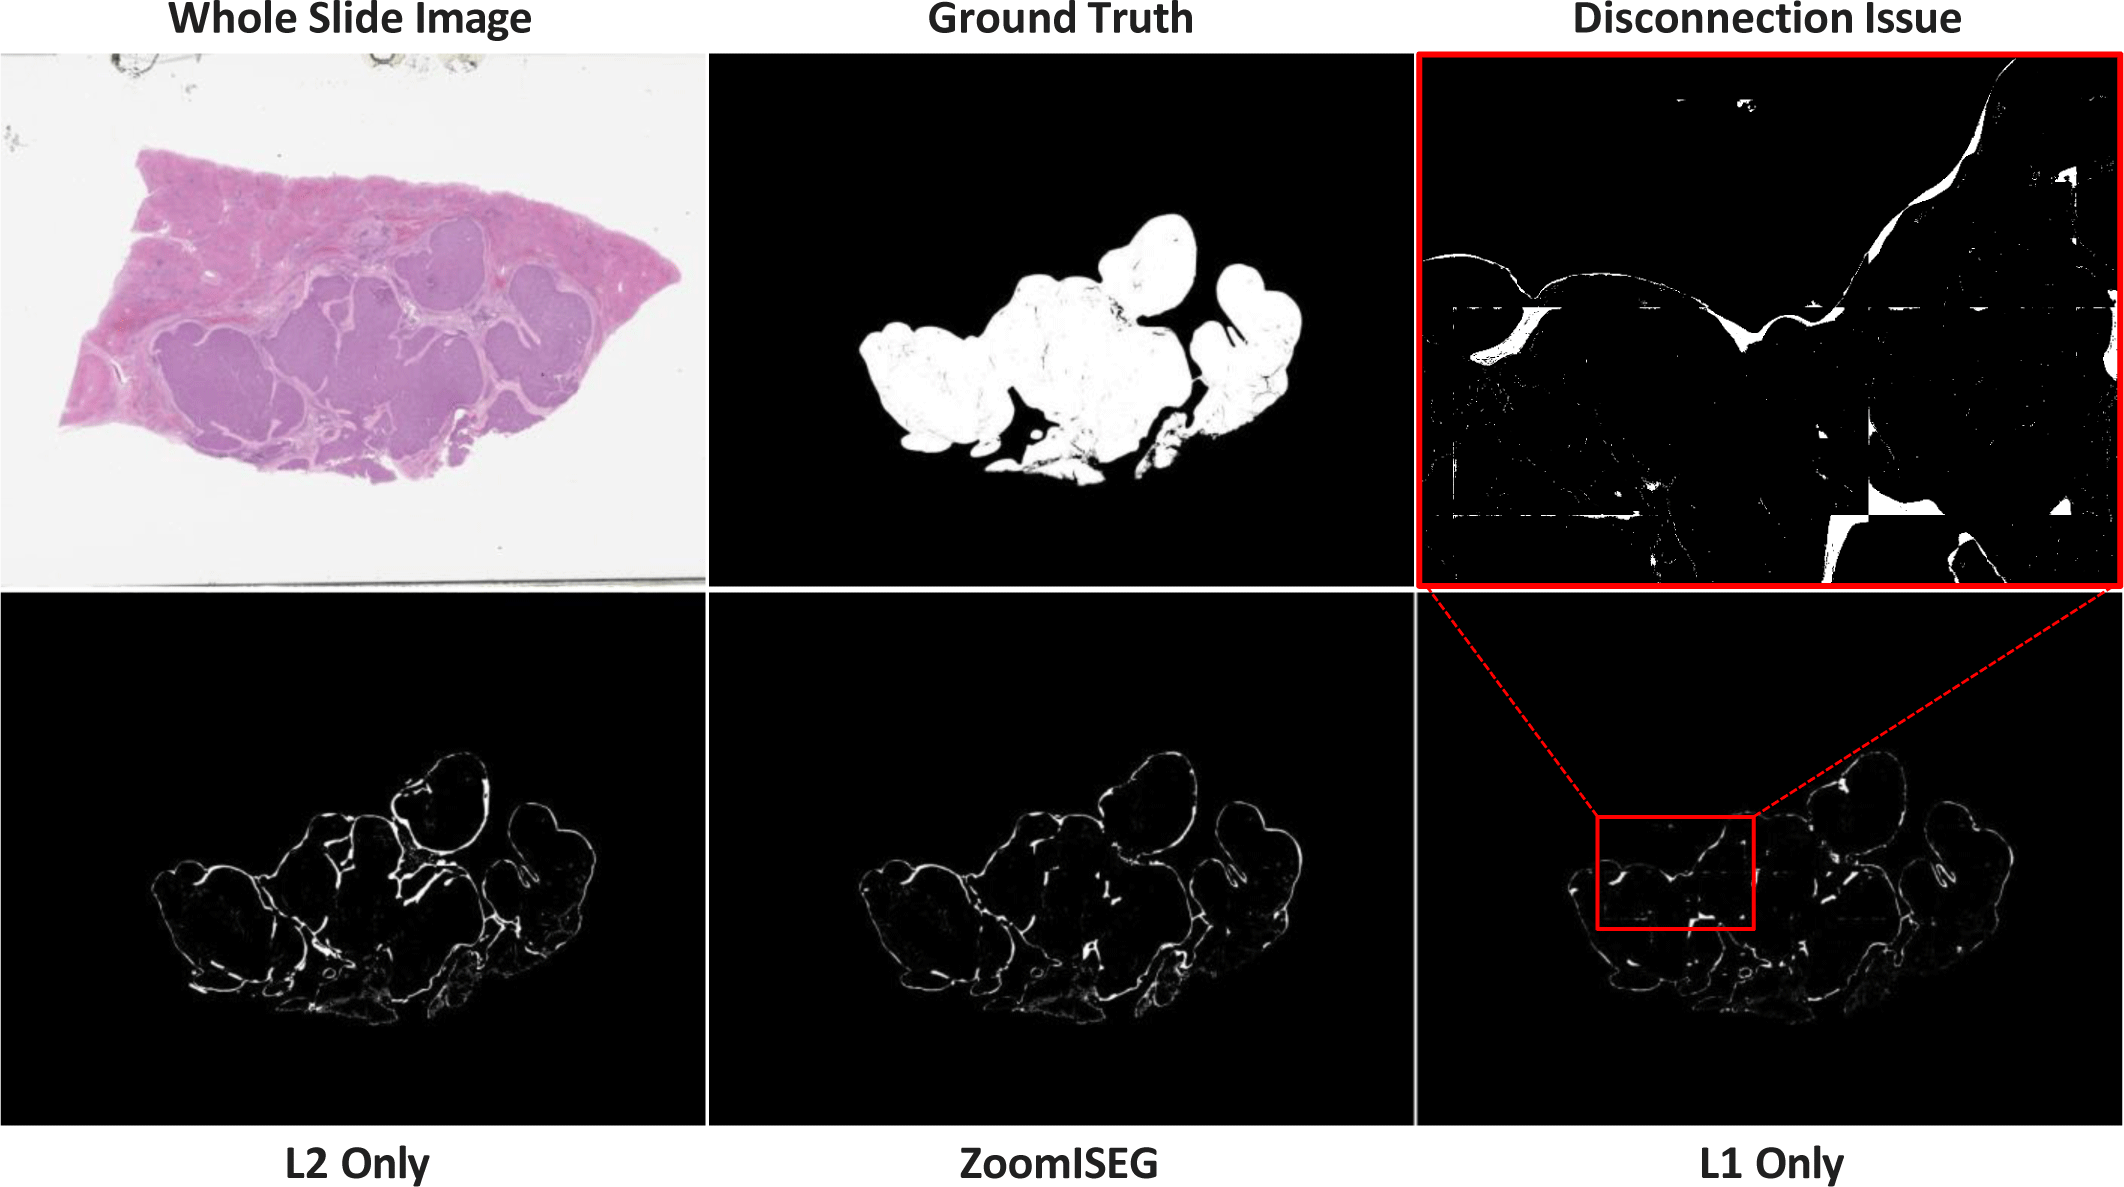
The recent development of deep-learning-based interactive segmentation in the computer vision field [4, 5, 6] can be a promising solution to address the challenging issues in WSI segmentation, e.g., DeepScribble [7] and CGAM [8]. Interactive segmentation allows the user to interact with the segmentation algorithm by selecting or correcting the segmentation results, which improves the accuracy of automatic segmentation and provides pathologists with a more efficient and intuitive tool for analyzing WSI. However, the adaptation of existing interactive segmentation methods in WSI segmentation is still challenging. The state-of-the-art (SOTA) methods [4, 5, 6] incorporate additional focus views on ROIs or use modern architectures such as vision transformers. However, as shown in Fig. 1, they still may not capture all the necessary details required for accurate segmentation due to the use of single-resolution images. This is especially problematic for ROIs with complex and heterogeneous structures in WSIs, such as tumor margins or infiltrating immune cells.
In this paper, to overcome this limitation, we propose a novel interactive segmentation method, ZoomISEG, that can effectively utilize multi-resolution WSIs. We enable information transfer from an image of one resolution to an image of another resolution by using the mask-type input of the network. We prevent the issue of user interaction uncertainty in WSIs, where segmentation is difficult due to ambiguous boundaries, by adding a new loss term referred to as click loss to the network training process. We implemented an algorithm that mimics real user behavior to quantitatively evaluate the proposed method on a pathology image dataset. The proposed method showed competitive performance by appropriately combining the efficiency of the model using low-resolution images and the high accuracy of the model using high-resolution images.
2. Methods
An overview of the proposed method is shown in Fig. 2. We define the WSIs at a magnification level of 5× as level 2 (L2) and the WSIs at a magnification level of 20× as level 1 (L1). The process of generating a segmentation mask for a WSI through ZoomISEG is as follows: First, a segmentation mask reflecting global context is generated from a low-resolution L2 image with a wide receptive field. Then, additional adjustments to the mask are made using detailed information from a high-resolution L1 image for areas that require fine-tuning. Finally, the L2 mask is upscaled to the size of the L1 image using a cubic interpolation scheme, and partial patch masks generated from L1 are overlaid onto it to complete the prediction. This method enables the generation of a comprehensive mask that captures the entire context at a low cost, without sacrificing the capture of crucial details in significant areas.
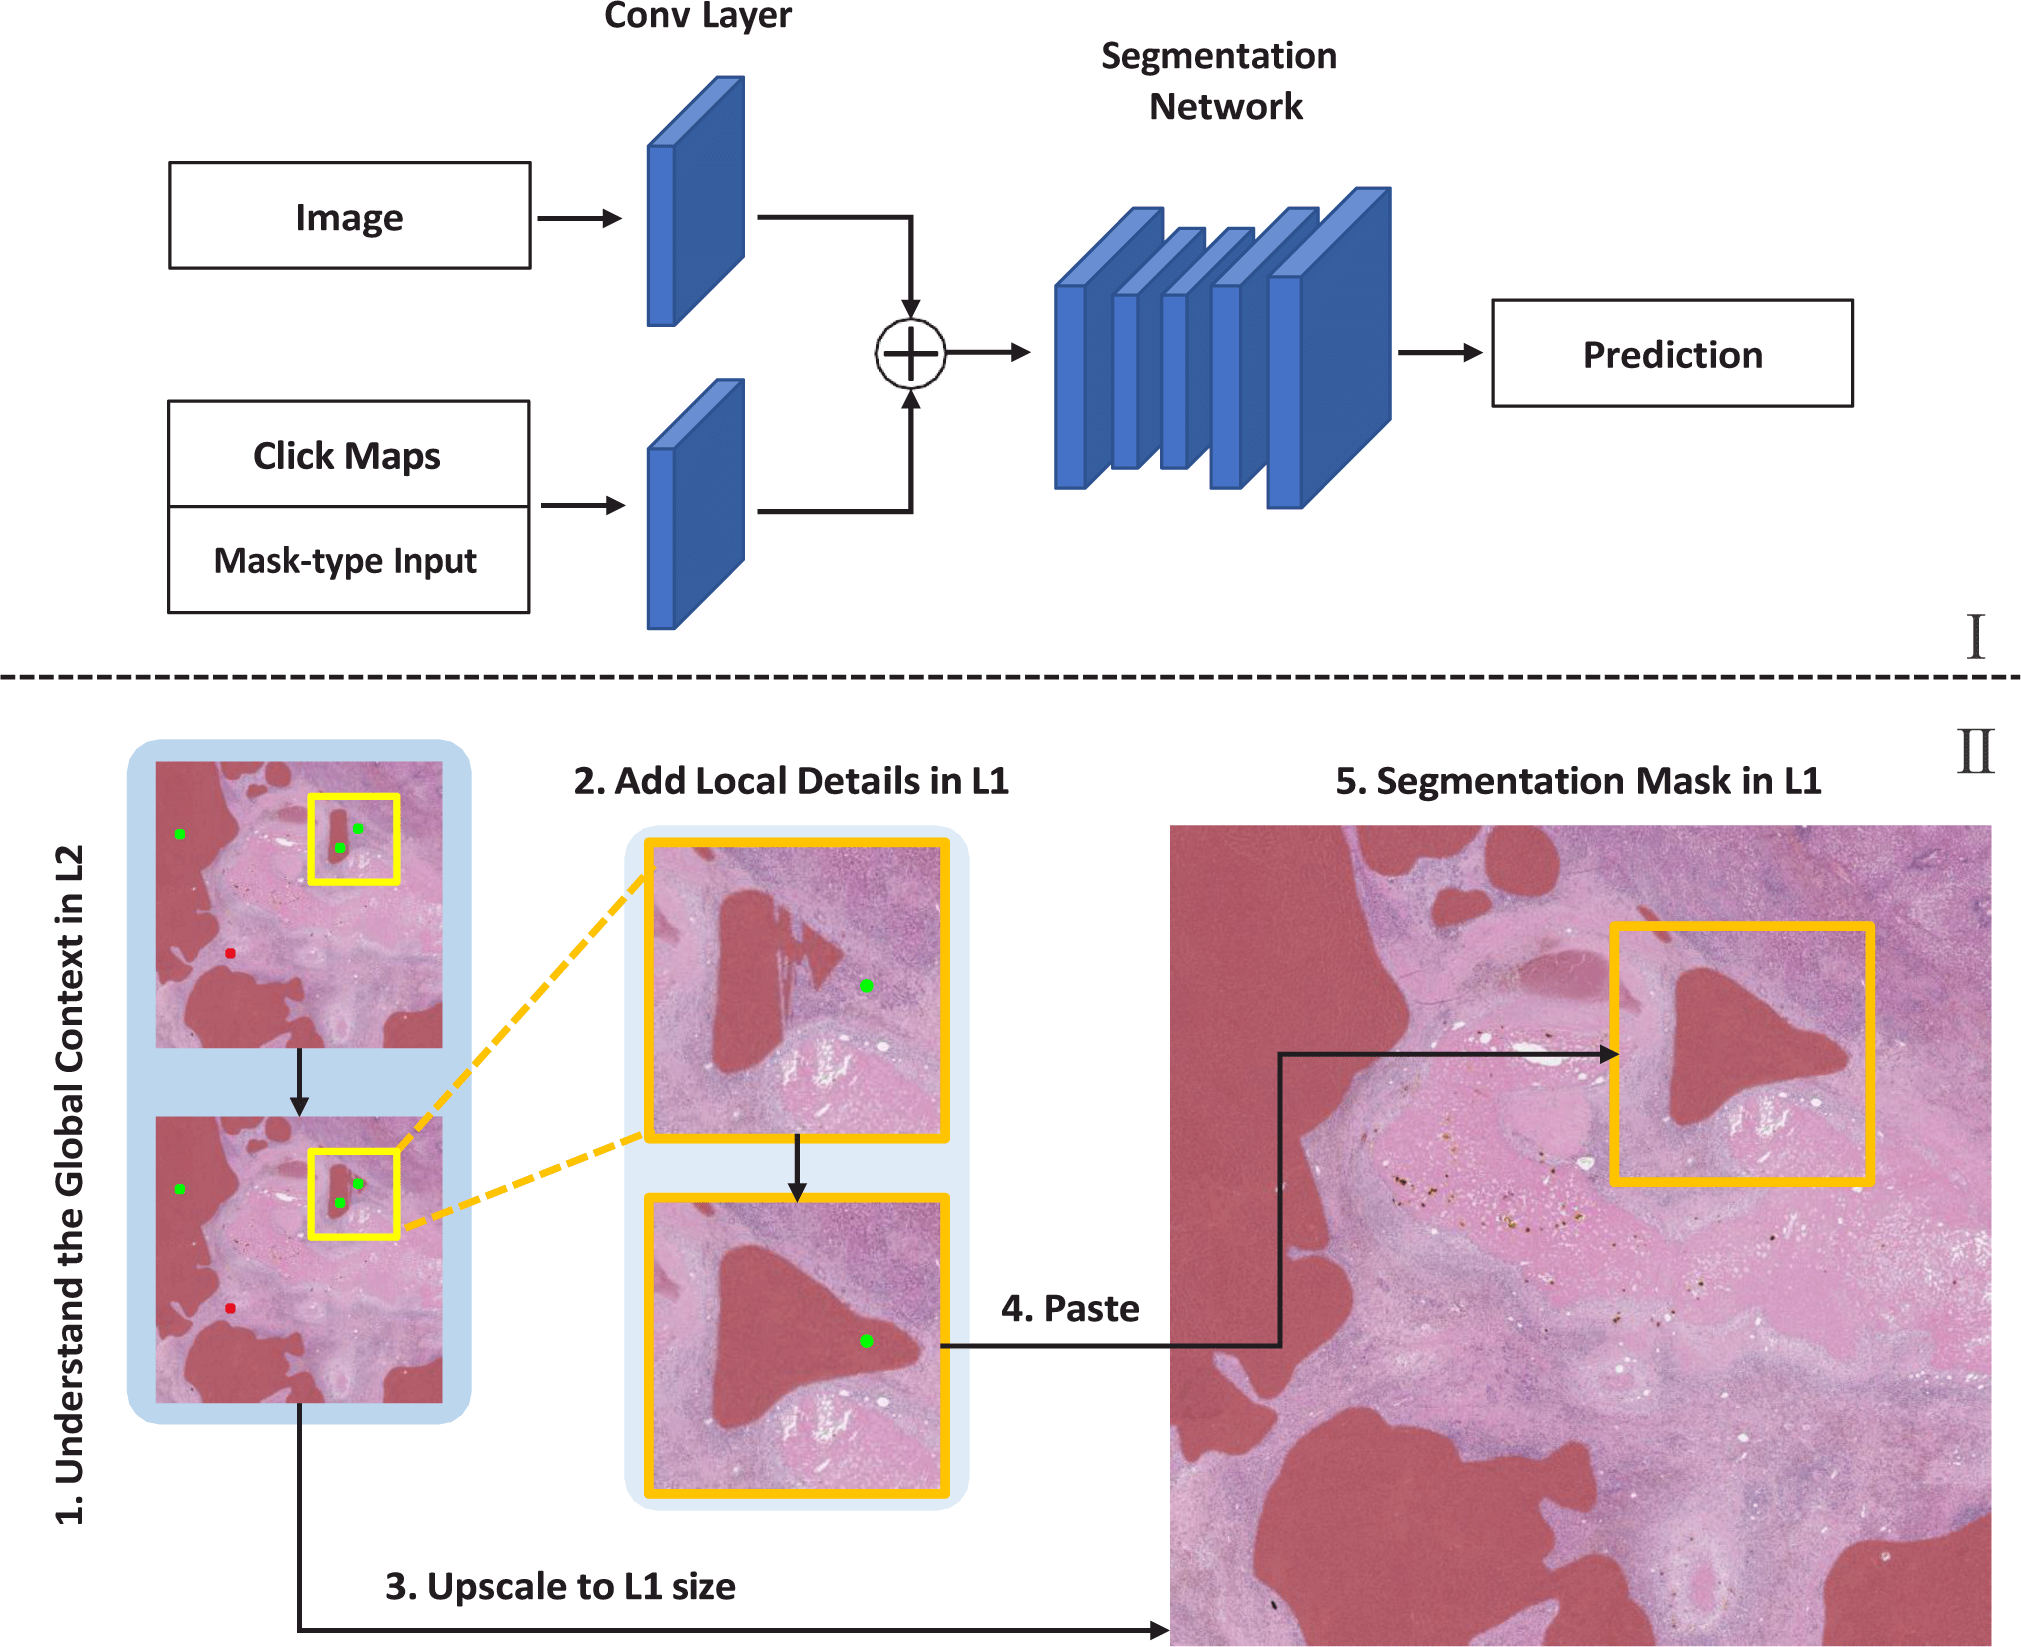
In deep-learning-based interactive segmentation, the neural network learns to incorporate click-type user interaction into segmentation masks. In this work, we modified two conventional segmentation neural networks, U-Net [3] and UCTransNet [9] for inter-active segmentation of L2 and L1 WSIs, respectively. The network takes an image along with click maps generated from user clicks as input. Click maps are 2-channel inputs that include positive clicks generated for the foreground and negative clicks generated for the background. The network also takes a mask-type input such as the previous mask generated for the previous click or an externally available external mask.
As shown in Fig. 2, the click maps and mask-type input are concatenated into a 3-channel. This 3-channel input and the input image are each passed through a separate branch to generate a 64-channel feature map, which is then combined with the other feature map via element-wise addition. U-Net and UCTransNet have multiple skip connections of different depths. To prevent the excessive dominance of click maps in generating segmentation masks (limited class changes confined to clicked regions), we made the following modification to the networks: The skip connection located at the shallowest part, which forms a connection before the 64-channel feature map generated from the input image, is added to the feature map generated from the click maps, and the second shallowest skip-connection is removed.
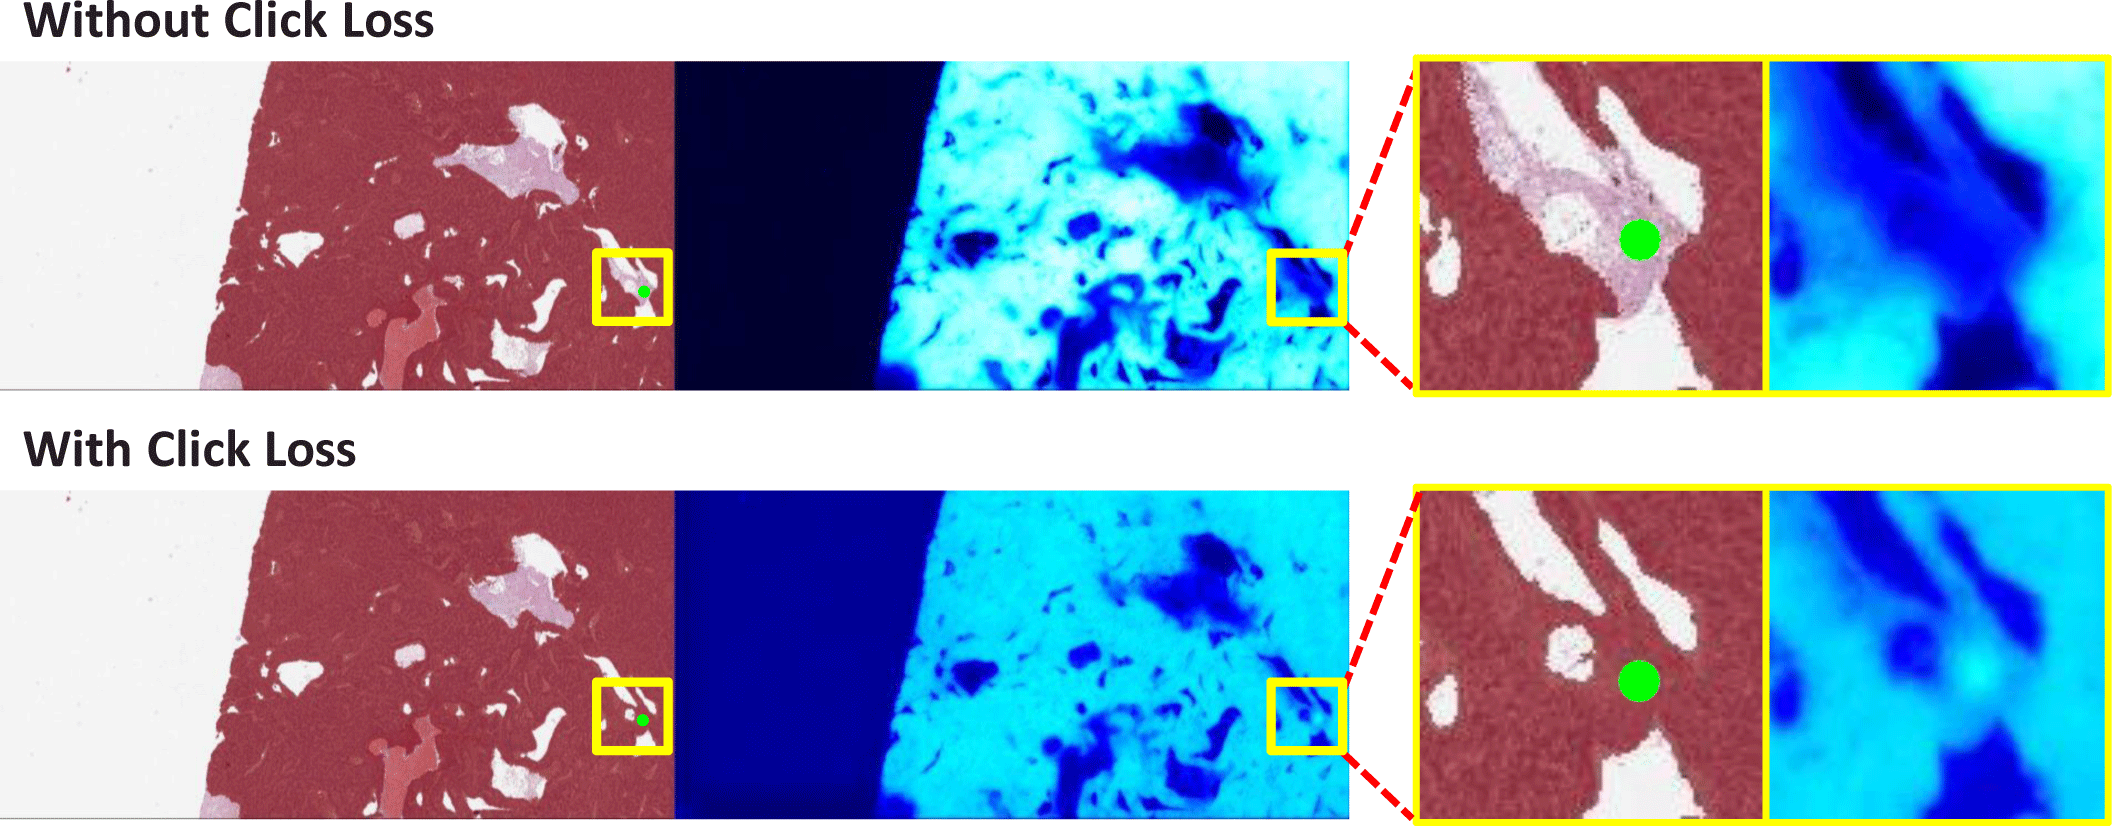
Adding mask-type input, such as an externally generated mask or the prediction mask generated for the previous click, to the network input is a commonly used method [4, 5] in interactive segmentation of natural image datasets. However, this degrades the segmentation performance for WSI. We address this issue by giving more weight to the impact of clicks through the incorporation of a new loss component, referred to as click loss, during model training.
We define a set of user-provided clicks as where (u, v) and l ∈ {−1, 1} represent the coordinates and label of each click, respectively. Assume f is a function implemented by the network. With an input image X and click maps C, click loss is calculated in the form of squared hinge loss, as follows:
The effect of training with click loss can be observed in Fig. 3.
Proper utilization of multi-resolution images enables rapid generation of high-quality, high-resolution segmentation results with less user interaction. To achieve this, it is important to capture the global context through a wide receptive field in low-resolution images that are reduced to small sizes and to leverage rich local features in high-resolution images only for important parts that require detail. Combining information from images of different resolutions can also have a synergistic effect when analyzing an image at a specific resolution. Low-to-high information transfer (L2H) provides how the region is segmented in a global context, including neighbor patch information, which is unknown in the corresponding single high-resolution patch that occupies a small portion of the entire image. The process of L2H is as follows: First, a segmentation mask for the entire WSI is generated in L2, and additional inference is performed in L1 for ROIs that require more detail. At this time, the L2 segmentation mask in the area corresponding to the L1 patch is cropped and entered as a mask-type input for the first click to the L1 model.
Require: L2 patch X2, label l2
1: fori = 1 toNoCmaxdo
2: Update click maps C2
3: Get prediction P2=network2(X2, C2)
4: d ← the minimum Euclidian distance between clicks
5: center coords ← the midpoint between the two clicks that generate d
6: q ← the IoU of P2 and l2
7: ifd < Dthr and Qthr < q < Qmaxord < Dminthen
8: Get L1 patch X1i with center coords
9: Get L2 mask M2i by cropping P2 corresponding to the location of X1i
10: for j = 1 to NoCmax do
11: Update click maps C1i
12: Get prediction P1i=network1(X1i, C1i, M2i)
13: end for
14: end if
15: end for
16: Get Pcoarse by scaling P2 to the size of L1
17: Get prediction P by pasting P1i to Pcoarse where i ∈ [1, NoCmax]
18: returnP
3. Experiments
We utilized the PAIP2019 challenge [10] dataset, which consisted of hepatocellular histopathology whole slide images and tumor region labels. A total of 441 WSIs were scaled to a magnification level of 5× for the L2 model, and a magnification level of 20× for the L1 model. Patches of size 1024 × 1024 were extracted from the WSIs. Among the patches with a magnification level of 5×, those that did not contain tumor regions were discarded, leaving a total of 1749 patches. At a magnification level of 20×, 12,480 patches were selected, where the tumor area accounted for 10% to 90% of the entire area. Patches at each magnification level were split into a 9:1 ratio to train and evaluate the corresponding model. Five WSIs were used to evaluate the entire process through zoom simulation.
Two metrics were used to measure the efficiency and performance of the proposed method. Mean intersection over union (mIoU) of the segmentation results was used to demonstrate the accuracy performance of the methods. The total number of clicks (tNoC) was used to show the efficiency of the methods by indicating how many user clicks were required to complete high-quality segmentation masks for the WSIs.
We implement our models in PyTorch and test with a single NVIDIA RTX A6000 GPU. We set the batch size to 4. We implement modified U-Net and UCTransNet described in Subsection 2.1 for L2 and L1 models. We trained our models using a combination of normalized focal loss proposed in [11] and click loss described in Subsection 2.2, where the scaling constant for click loss was 0.05. We sampled the clicks during training following the procedure of [12]. We use the Adam optimizer with β1 = 0.9, β2 = 0.999. We set the learning rate to 5 × 10⁻⁵. We trained the L1 network for 40 epochs and the L2 network for 100 epochs.
We implement automatic zoom simulation that simulates user behavior to quantitatively validate the interactive multi-resolution WSI segmentation method. The need for refinement in L1 is determined by the distribution of the clicks and the quality of the mask generated in L2. The distance between clicks is used to represent the distribution of clicks and predict which part of the image should be zoomed in for segmentation at higher magnification. The process moves on to L1 after ensuring that the quality of the L2 mask is satisfactory enough. This simulates users sequentially analyzing multi-resolution images starting from low resolution. Zoom simulation is conducted according to Algorithm 1. If the quality of the L2 mask is better than Qmax, it is judged that additional modifications are unnecessary. If the minimum distance between clicks is less than Dmin, it is judged that the ROI is too small for analysis in L2, and zoomed in using L1. Otherwise, if the minimum distance between clicks is less than Dthr and the quality of the L2 mask is better than Qthr, it is judged that zooming is required. The default Dmin, Dthr, Qthr, Qmax, and NoCmax is set to 50, 250, 0.85, 0.95, and 20 respectively.
We compare our method ZoomISEG with single-resolution models of different magnification levels. Since the L2 model is designed to handle relatively small and low-resolution images, it tends to infer only a small number of patches when the image is divided into patches of the same size. Therefore, it is possible to generate a segmentation mask with only a small number of clicks, but this approach shows relatively lower accuracy. On the other hand, the L1 model is able to distinguish the boundaries of tumor regions more precisely as it is designed to handle high-resolution images. However, as the image size increases, the number of patches that need to be processed also increases, and the number of clicks that users need to input also increases. In addition, the process of independently processing a large number of patches and then reassembling them can lead to visual artifacts (disconnection issues) similar to the example shown in Fig. 4. ZoomISEG combines the advantages of each model to increase the accuracy of predictions at a reasonable cost. For regions of interest where details are important, ZoomISEG utilizes high-resolution images to achieve high accuracy, while performing inference on low-resolution images for the rest of the areas to maximize efficiency. As shown in Table 1, compared to the L2 model, the L1 model increased its performance by 5.37%p by adding 739 more clicks, while ZoomISEG achieved a 2.13%p performance increase with only 247 additional clicks.
| Comparison of Methods | Ablation Study | ||||
|---|---|---|---|---|---|
| Method | L2 only | ZoomISEG (L2+L1) | L1 only | w/o L2H | w/o click loss |
| mIoU | 0.894 | 0.913 | 0.942 | 0.909 | 0.868 |
| tNoC | 138 | 385 | 867 | 394 | 1579 |
We conducted an ablation study to examine the effectiveness of low-to-high information transfer and click loss. As shown in Table 1, both L2H and click loss contributed to improving the model. In the case of the L1 model, only high-resolution local areas are independently inferred as patches, so even adjacent areas cannot be fully known. However, by receiving global context information from larger areas generated by the L2 model through L2H, it is possible to more effectively create high-quality masks. Click loss helps ensure that the model assigns the designated class to the area where the user has clicked, without confusion caused by the difficulty of learning ambiguous boundaries of cancerous regions in pathological images during training.
4. Conclusion
In this paper, we introduce ZoomISEG, the interactive multi-resolution WSI segmentation method. By utilizing WSIs of different magnification levels, ZoomISEG can generate predictions more efficiently than a single high-resolution model and more accurately than a single low-resolution model. The limitation of this study is that currently only uni-directional information transfer from low-to-high is possible. In the future, we plan to develop a bi-directional information propagation scheme. We expect ZoomISEG can provide convenience in pathologists’ workflow when employed in the analysis or annotation tools they use.


